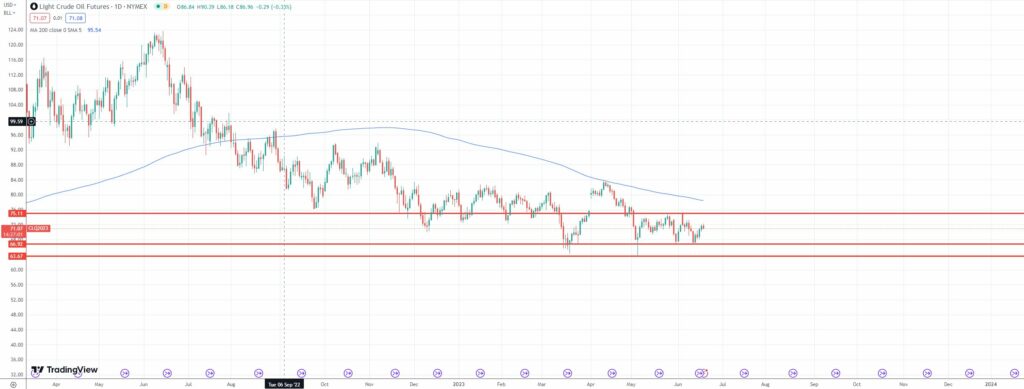
One of the most exciting markets during the pandemic when we saw negative prices print on futures markets and followed by the strong recovery which briefly took us at prices of above 100 USD per barrel, Oil has recently been one of the quiet markets in terms of price action with prices mainly moving sideways since the end of 2022.
Fundamental developments
While the price action hasn’t been exciting, nevertheless in terms of fundamentals we have seen some interesting developments. More importantly output cuts by OPEC+ haven’t really driven a move to the upside.
What is this a sign for? Possible weaker global demand as some economies enter recession and current conditions of high inflation partnered with the raise of interest rates.
Discover luxury with the Patek Philippe clone, offering unmatched elegance and precision craftsmanship in every detail: https://replicapatekphilippe.io/
Even more important recent development is the clash between US and Saudi Arabia. The Saudi Crown Prince threatened the US with ‘major’ economic pain. This came after President Biden expressing displeasure and also threatening with consequences Saudi Arabia, after they slashed their oil output.
Where could this lead crude oil prices?
Saudi supporters, or maybe we should say the anti-US camp tend to think that the Saudis will try to push prices high, and this could certainly make things difficult for Biden as his popularity before the election can suffer. It could also lead to another spike in inflation which will make it necessary for the Federal Reserve to raise rates further. This could bring the ‘major’ economic pain which Mohammed bin Salman threatened.
The other scenario is that this price war may drive crude oil prices down with Nassim Taleb calling for a price of 10 USD. This will certainly be great for the US consumer and politicians. It will also mean economic pain for Saudi Arabia.
Technical analysis

WTI Futures Chart
In the end of 2022 and beginning of this year, 75USD per barrel tended to act as support for WTI. Although we saw brief movements below that level, the price tended to go back up above it and aim towards 80USD.
Then in March we had a stronger move below 75 which took us for the first time towards the lows for this year of 64-63USD per barrel.
Following this move we had a gap opening higher in April after OPEC announced their first output cut. We saw the price test the 200-day SMA before retreating lower back below 75.
Since then, we have had sideways action between 75 and 67 with one exception when the price recorded a new yearly low of 63.64.
These are the key levels to monitor going forward. A move above 75 can lead to a test of the 200-day moving average. If the price breaks above the moving average, we can see a prolonged move to the upside which would please the Saudis and OPEC.
The low of 63.64 is the one to be monitored by bears. If the price tests this level and we see a convincing break below, we can see the move which will please the US and western consumers.
Until then monitoring the range between 75 and 67 can create trading options for the range trading enthusiasts.
Interested in trading WTI? Find your commodities broker using our website.


