
There are a lot of factors that might be quite beneficial in predicting the real bitcoin crash. Historically, these indicators have shown to be quite valuable in finding these crashes, and traders should keep a watch on them in the future.
Broker Review Contents
Indicators For Bitcoin Crash
Bitcoin Crash Indicator: MVRV
The Market Value to Realized Value ( MVRV) is the ratio of a cryptocurrency’s market cap to its realized cap.
The realized cap refers to the coins’ cost basis, but the market cap refers to the supply’s actual worth. The indicator indicates whether the price of Bitcoin is now overvalued, crahed, or undervalued.
When the signal is high, it means that the asset now has a substantial amount of unrealized profit trapped in it. A top structure normally occurs when MVRV readings exceed 3.5, as investors become more ready to harvest their gains at such high levels.
The graph below depicts the following: the green horizontal line indicates a wonderful chance to purchase when MVRV falls below 1, while the red horizontal line indicates that when MVRV is above this, the bitcoin price normally retraces. The yellow arrows on the graphic indicate the bottom of the bitcoin price and the MVRV. The red arrows represent the peak in the MVRV and the Bitcoin price.
The more up to date chart is available here
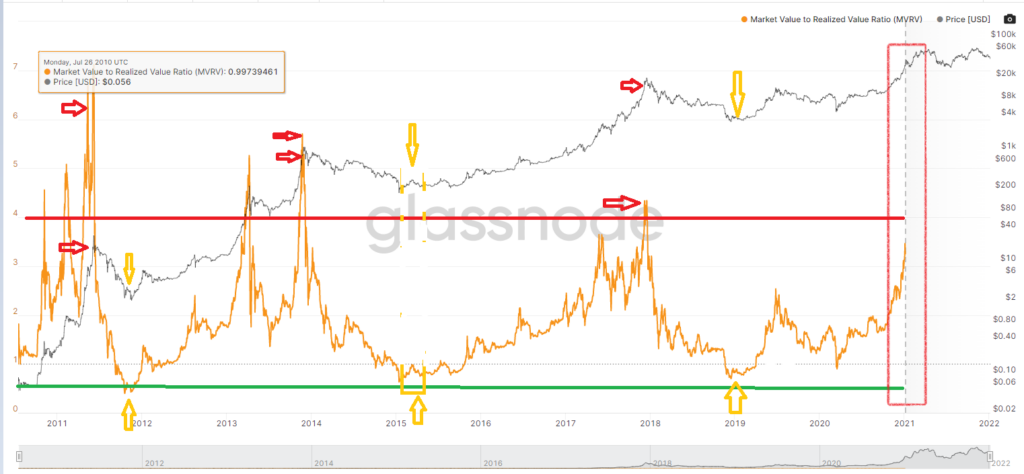
The above chart shows that bitcoin is likely to move higher and it is not anywhere close enough to its oversold zone.
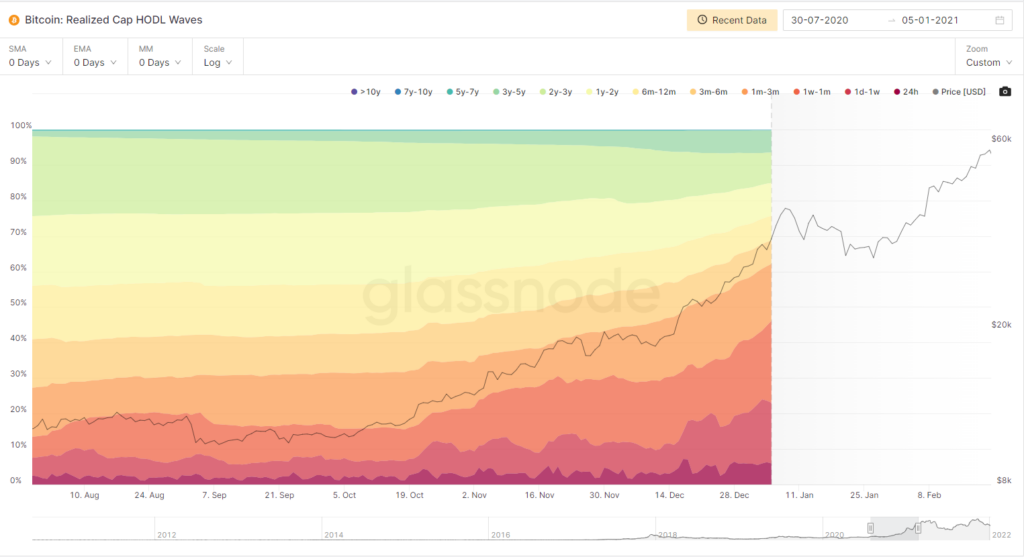
Bitcoin Crash Indicator: Realized Cap HODL Waves
This indicator gives us the information about bitcoin investors comfortablity level. As long as the waves continuets to rise, it means Hodlers are happy with their positions.
The chart below shows that bitcoin investors are highly comfortable because different time wavelengths are only growing, implying that the majority isn’t concerned about the bitcoin price drop.
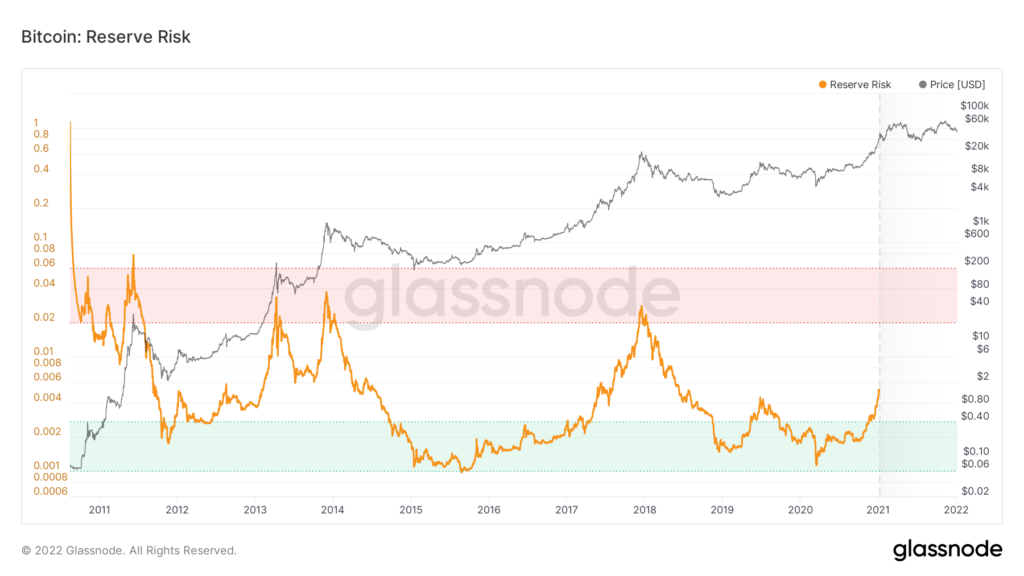
Bitcoin Crash Indicator: Reserve Risk
Price / HODL Bank is how Reserve Risk is calculated. It is utilised to assess long-term holders’ confidence of an investor in the given cryptocurrency at any given time. Traders may want to invest when confidence is high and prices are low (Reserve Risk is low). When there is little confidence and prices are high, the risk/reward ratio is unfavorable (Reserve Risk is high).
Key Takeaway
Bitcoin price is still moving higher and the above indicators shows that it is likely that we will see the price continue to move higher.
Don’t wait and find your best broker or exchange here and trade BTC while you have the opportunity.


